
A Jeopardy! "Fatigue Analysis"
No, this has nothing to do with the number or placement of tournaments

Much like the origin of the Master Station List, one of my compilations of Jeopardy! data springs from a desire to go chase down an answer.1
When Jason Zuffranieri was defeated in his 20th game, The Jeopardy! Fan quoted the contestant coordinators:
The show’s contestant co-ordinators have a maxim: “Champions lose on Thursday”, and that held true today. It’s because it’s the first game back after lunch, and there’s a chance for the champion to lose their mojo over the lunch break. With the buzzer stats being only 22-17-16, it seemed as though Jason didn’t have the same mojo that he went into lunch with.
Seeing that, I thought but three words in reply: “test the claim.”
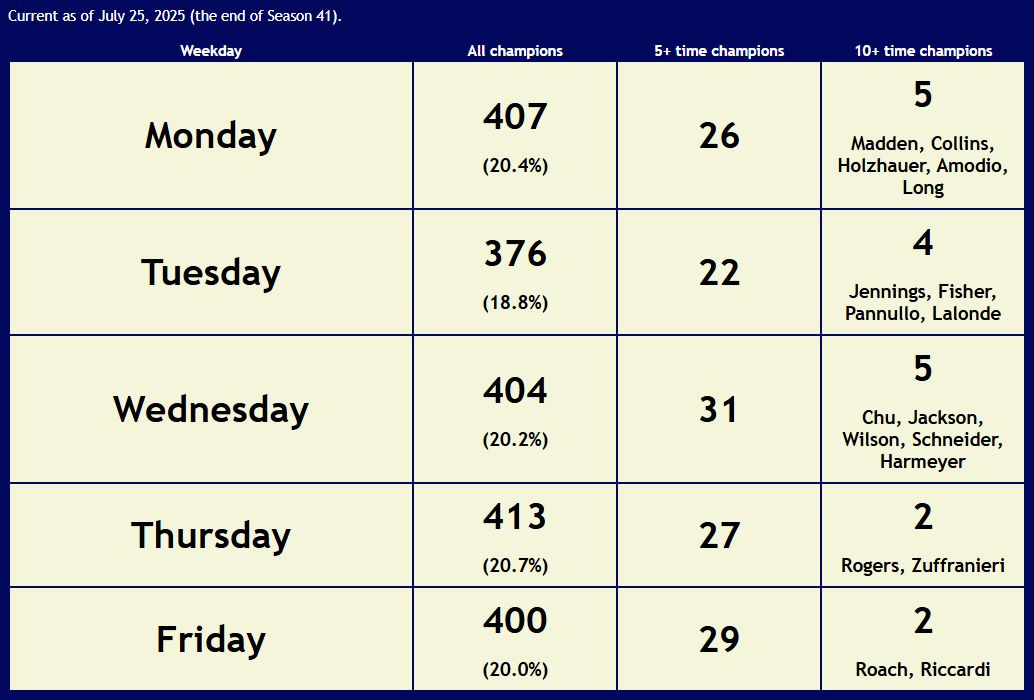
Thanks to J! Archive, I eventually got there. I figured out the day of loss for every champion since Jeopardy went to “sky’s the limit” at the start of Season 20 in September 2003. What did it reveal: champions did lose more often on Thursday than on any other weekday, but the differences among the five days of the week were not very large. Here’s what that page looked like.
That “position in the tape day doesn’t precisely correlate to weekday” was brought up to me not long after I put up “champions by weekday” on the site. Including by the great Robert KS, Founding Archivist and Jeopardy! champion. I took his note under advisement, but left the page as it was. Only back in March did this resurface in my head, in the discussion thread on the March 20 game. I and others mentioned the work I’d done; I also noted: “There’s probably enough information in either the Archive or at JBoard to extend this to position in the taping day. It would take some time, but I might take it on.”
Indeed there was — and indeed I did. Thanks to gameshowfandanny, there’s a thread listing tapings going all the way back to the very start of the current version in 1984. Using that as a basis, and with the caveat that the statistics I’ve derived are only as good as that underlying information, I have now compiled loss rates for both absolute and relative position in a taping day.
“Absolute” position is where the game was overall — for example, the third game taped on a given day.
“Relative” position is what game of the day it was for the defending champion — for example, a champ playing their third game of a given tape day.
Here’s a snapshot from my spreadsheet, covering the last seven weeks of Season 41 — so it includes the long streak of one-day winners, as well as Scott Riccardi’s 16-day reign.
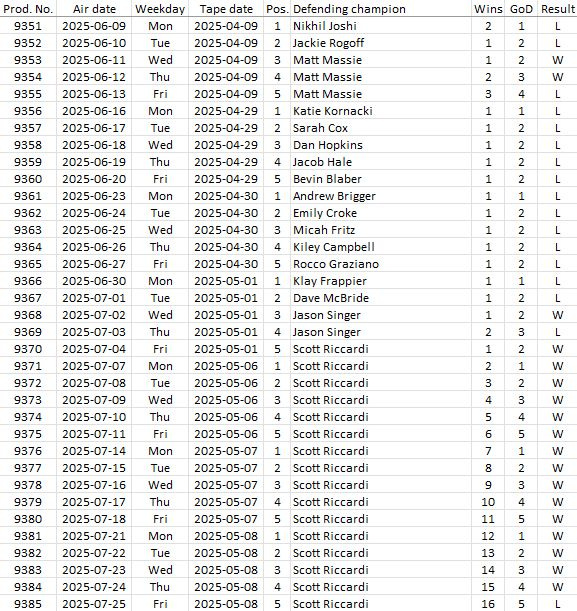
I’ll translate the last row into plain English. “Production number 9385,2 aired Friday, July 25, 2025. Fifth game taped on May 8, 2025. Scott Riccardi, 16-time defending champion, playing his fifth game of that day. He lost.”
As I was assembling this new data set, I also realized something else about what I had on the page then:
I'm a little more than halfway through collecting the data by tape day and position. Doing so has caused me to realize that the percentages I show on that page may not be as valuable as I thought — they're possibly not getting to the right thing.
Put succinctly, the denominator might not be best suited. Instead of all champions, period (presently 1,959 losses by 1,957[3] contestants since the start of Season 20), I need to determine how many champions defended on Monday (or in the first game of a tape day) et al. That's properly a better indicator of how fatigue might impact champions.
This is something I'll be incorporating into the presentation of losses by placement in the tape day, when I draw it up; I'll have to work it into the "by weekday" page as well. (There are some tricky instances that have to be accounted for when there wasn't exactly one defending champion, but those are few and far between enough to catch them)
Fortunately, it wasn’t hard to write the proper COUNTIFS formulae to make all that happen.
”Champions’ losses my weekday” is now the “fatigue analysis”
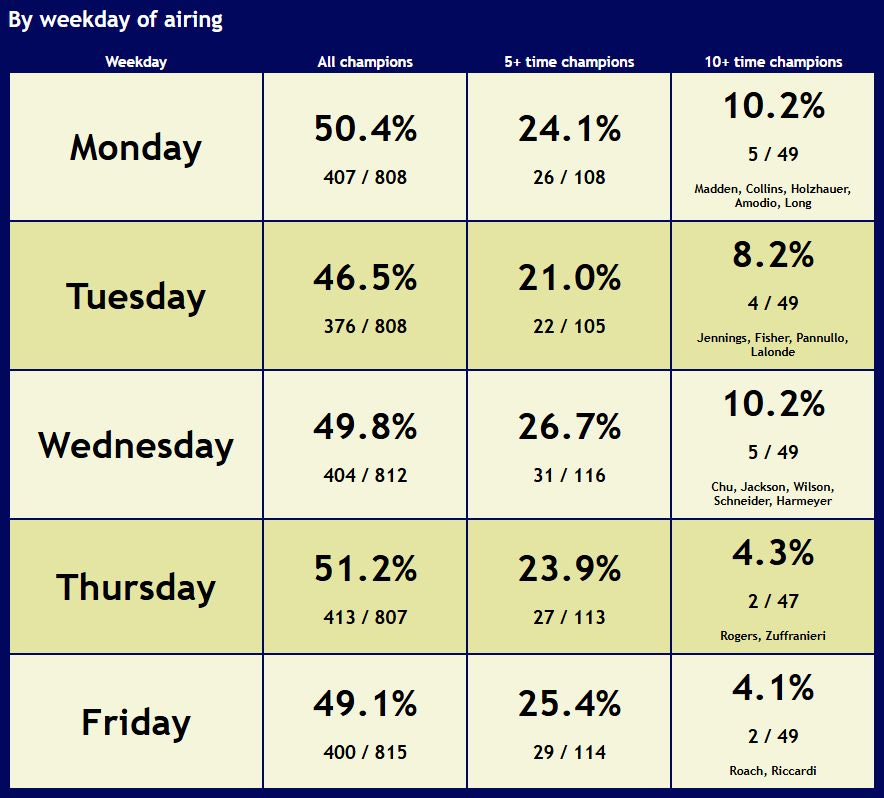
The old page now redirects to the new one. For all champions, as well as only for those defending streaks of five or ten games, now shown are (losses / opportunities) for each particular day. Here’s what it looks like right now.
So for example, for all champions on Monday:
The old presentation showed 20.4%. That was: “There have been 2,000 losses by champions since the start of Season 20. 407 of them were in games aired on Mondays.”
The new presentation shows 50.4%. It is: “Since the start of Season 20, a champion has defended in a game aired on a Monday on 808 occasions. They were defeated 407 times.”
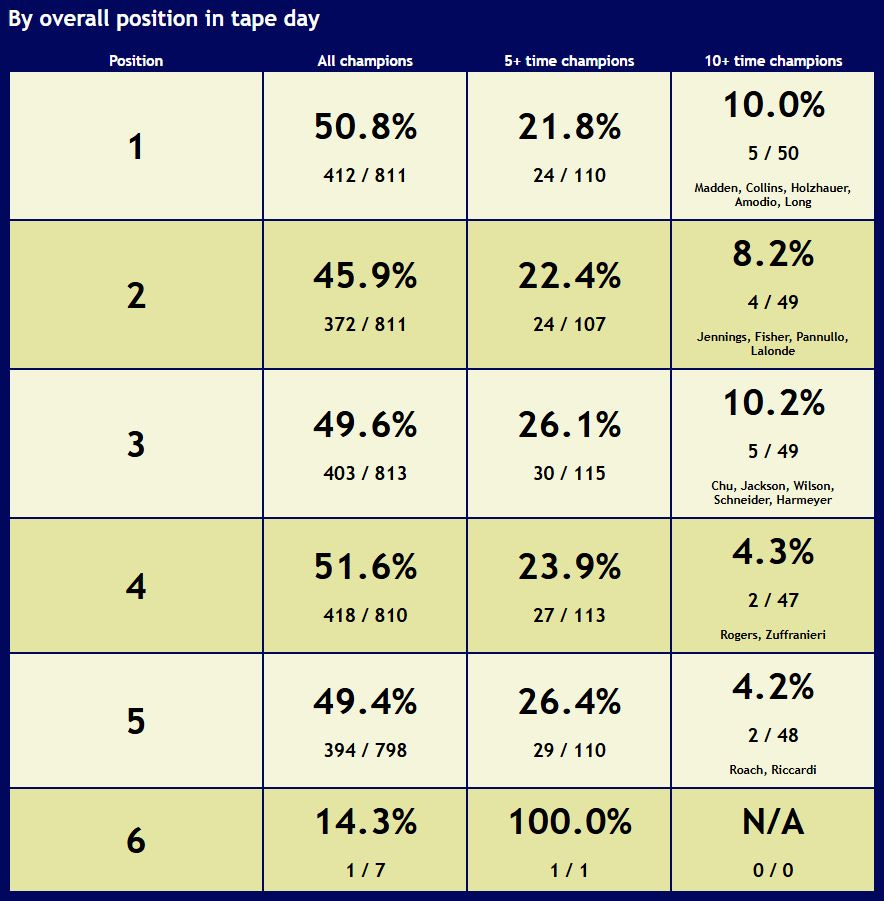
For weekday and absolute position in the tape day, the numbers really don’t change relative to each other. This is because the overwhelming majority of tape days over the course of the twenty-two season span correspond to a Monday to Friday airing week. Where you see a bit more of a divergence, however, is in the breakdown of what game of the day it is for a specific champion.
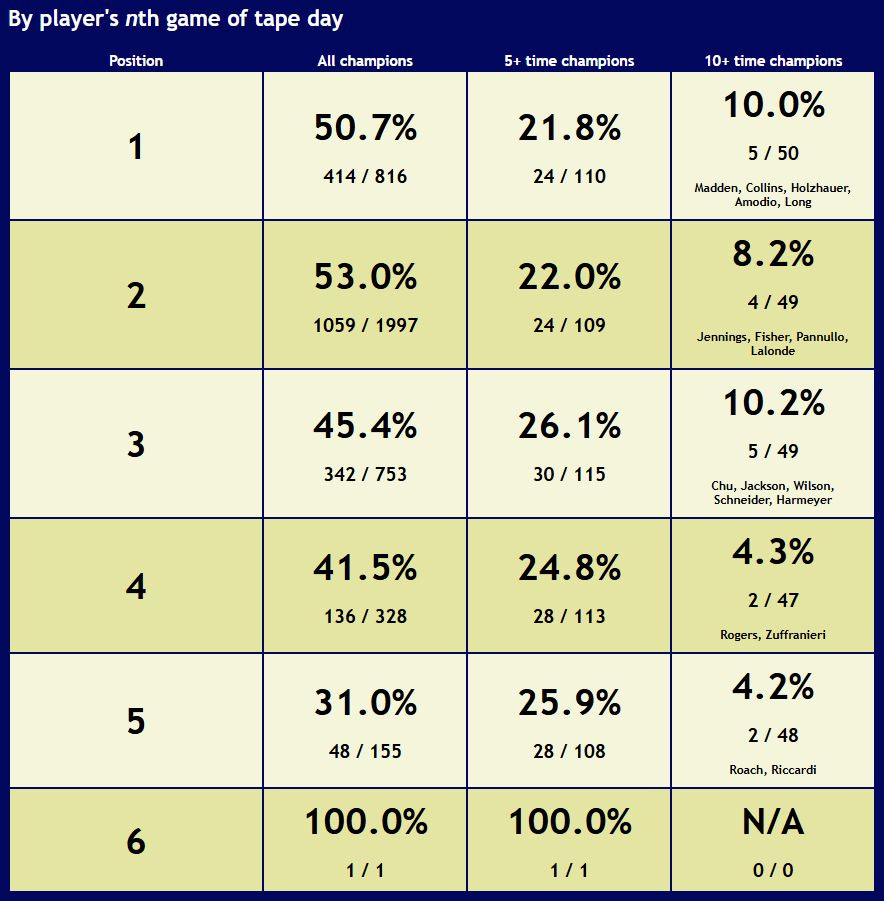
It makes sense that this will be weighted toward a player’s second game of the day; that’s what a newly minted Jeopardy! champion is playing, for the most part. Beyond that, it also is intuitive that the percentage will drop the more games a player has played on a tape day. After all, a player getting to their fourth or fifth game in succession has already won three or four respectively, indicating their quality.
The same goes for five-game and ten-game champions. The numbers shown only take into account records once players have reached those thresholds.4 For example, Ken Jennings alone accounts for more than a quarter of the defenses by super-champions — 65 of 243 (his eleventh through seventy-fifth games; and of course, he went 64-1 in them). The percentages for the different positions in a tape day aren’t meaningfully different for the 5+ game winners. What I do note is that when we take the super-champions alone, the percentages for their fourth and fifth games on a day are noticeably lower. That’s after the lunch break; I do wonder if there could be something to that. But it could just as well be chalked up to the small sample size of only eighteen players.
For the benefit of anyone who might be wondering, after looking at those tables — the one player who played in all six games of a regular play tape day, and lost the sixth one, was 8-time champion Stephen Webb.
Tracking this down now takes on additional importance
The traditional tournament format didn’t generally impact upon the usual correspondence of a tape day to a calendar week of games. Even when tournaments started on Wednesday, a single regular play tape day would wrap around, with the first two games airing before the tournament, and the remaining three after it.
But in this Brave New World of Jeopardy!, the number of postseason games is uncertain until they’re actually played. The aggregate length of the tournaments has a six-game range, given the current structure of the finals of the Tournament of Champions and the Jeopardy! Invitational Tournament. Consequently, only after those tournaments are filmed can the show plan out the remainder of its season.
In the two preceding seasons, this has been accomplished by adding one additional game to some number of tape days — three in Season 40, and one in Season 41. Hence, going forward, “a tape day maps onto Monday to Friday” is much more tenuous, especially in the second half of the season.
Next week
This long weekend, I’ll be again checking television schedules in every media market in the United States, and I’ll have a post detailing the changes, and possibly looking at possible preemption impacts. (I only yesterday saw something alerting me to a new one: the NBA on NBC on Tuesday nights.) There’ll also be a Season 42 preview/FAQ. And I do still need to write about Daily Double and Final Jeopardy! get rates, as well as when the Daily Doubles are found, over the years.
During the 2016 summer hiatus, I put together a rudimentary page that would spit out a countdown clock to the start of Season 33, indexed to 7:00 PM Eastern Daylight Time. A year later, I wanted to extend that to the whole United States. Two months later, I thought: I’ve made this list of stations, networks, and air times. Perhaps it would be useful to the community? And so it has.
For all seasons other than the first, the production number is 65 higher than the actual number of episodes aired. This is because during the 1985 summer hiatus, the reruns were assigned new numbers (196-260) in addition to their original ones; this was not repeated. So Season 1 games are 1-195; Season 2, Episode 1 is production no. 261. Hence, the Season 41 finale, though numbered 9385, was the 9,320th episode of the syndicated program.
Another benefit of going back through this was “data hygiene” and error correction. I had only accounted for the two players who lost twice as champions and reached five or more wins in total; there were two others I hadn’t accounted for. As of the end of Season 41, the counts over the prior 22 seasons are 2,000 losses by 1,996 champions. (Yes, Scott Riccardi’s defeat on the final day of the season made the loss count a round number.)
This is also reflected in the accounting of the four players who lost twice as champions. In the first column (all champions), both losses of each of the four are included. In the second column (5+ time champions), only the second losses of Bob Mesko and Ryan Fenster come in — because when they both first lost, neither was a five-time champion yet (three and four, respectively).
My taping schedule was very wonky.
My first tape day was a 6 game tape day (I played games 2-6) and those episodes aired Thursday-Wednesday.
I lost on a Thursday, which was also the first game of my second day.
It’s worth mentioning that the lunch break is sometimes before the Wednesday game. That’s how it was on my tape day. Will Yancey has also mentioned that the delicious baked potato at the commissary may cause sluggishness